

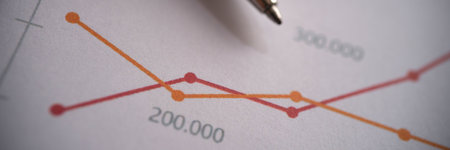
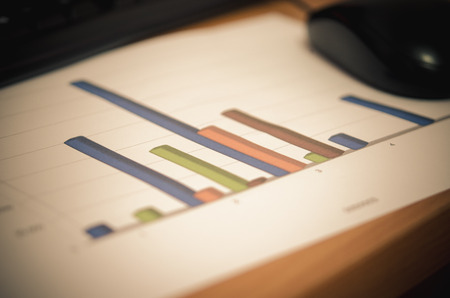
3d render A series of black bars are stacked on top of each other
Коллекция по умолчанию
Коллекция по умолчанию
Создать новую

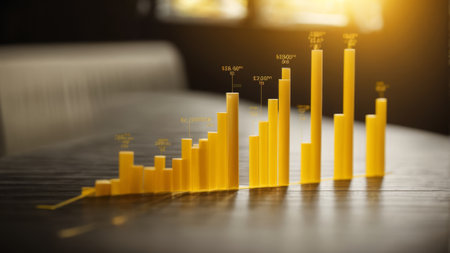
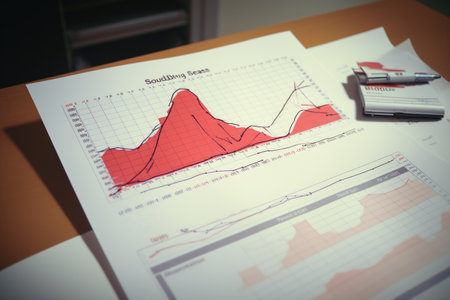
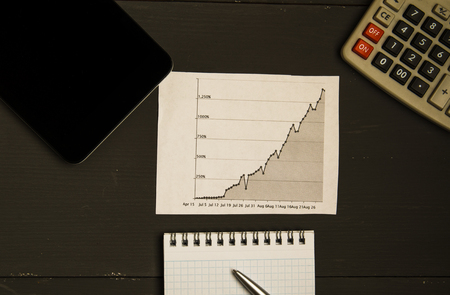
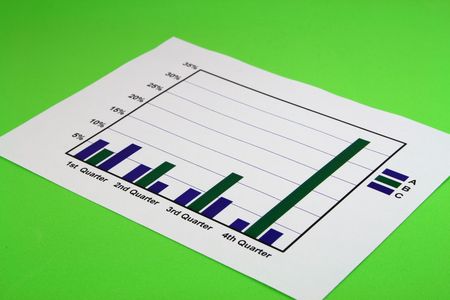
Increase in diagram. Shallow DOF!
Коллекция по умолчанию
Коллекция по умолчанию
Создать новую
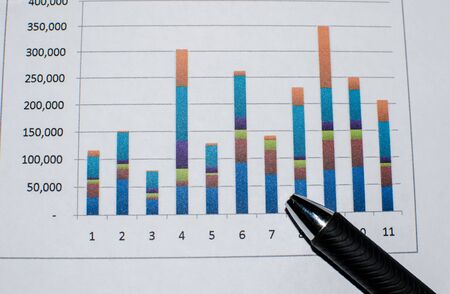
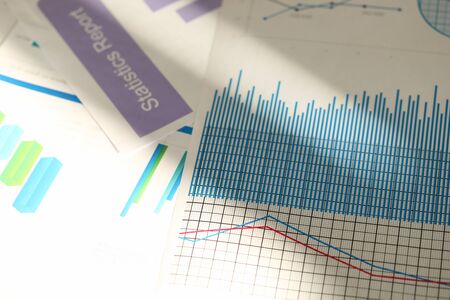
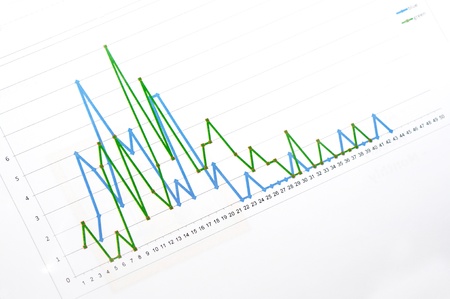
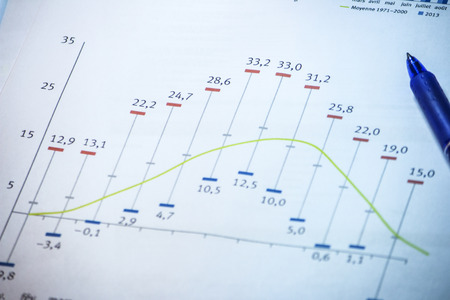
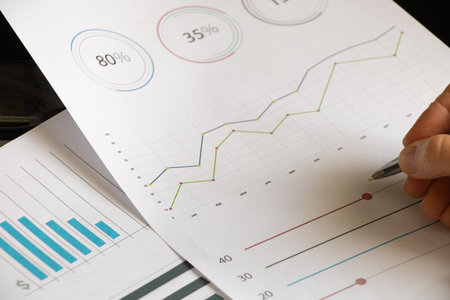
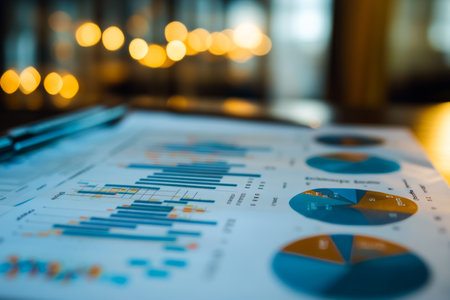
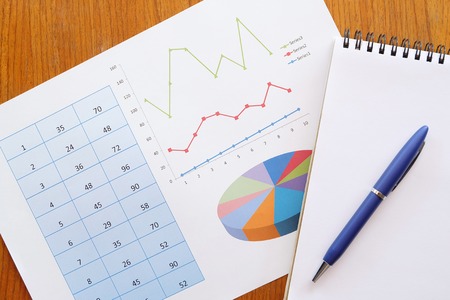
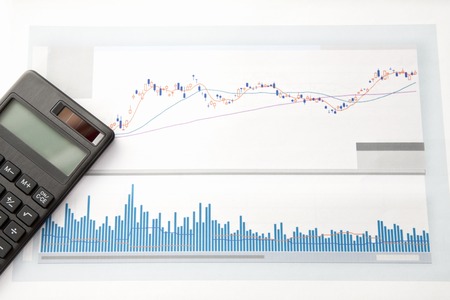
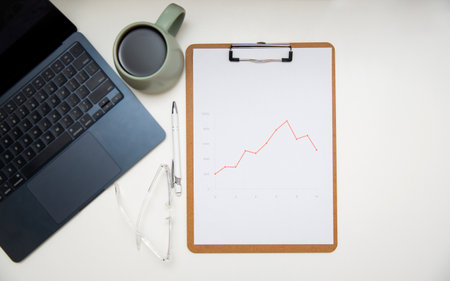
Financial graphs analysis and pen.
Коллекция по умолчанию
Коллекция по умолчанию
Создать новую

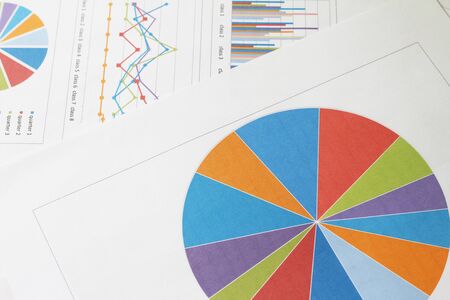
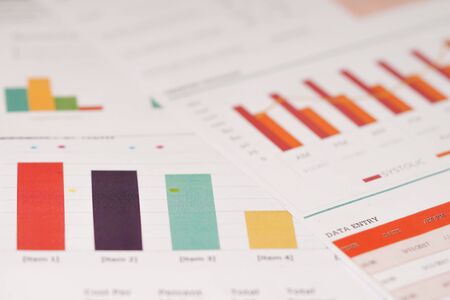
Poster infographics information business modern design set proposal advert. Vector illustration with graphic scheme
Коллекция по умолчанию
Коллекция по умолчанию
Создать новую
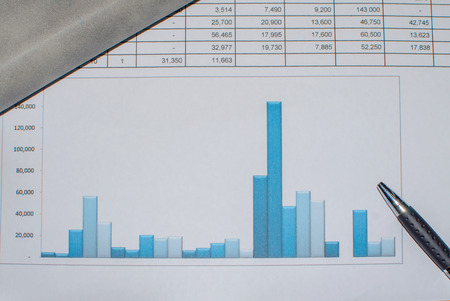
Business graph and chart on table. Business and finance concept. 3D Rendering
Коллекция по умолчанию
Коллекция по умолчанию
Создать новую
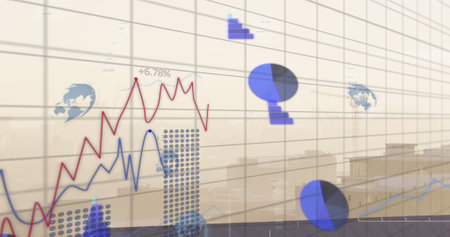
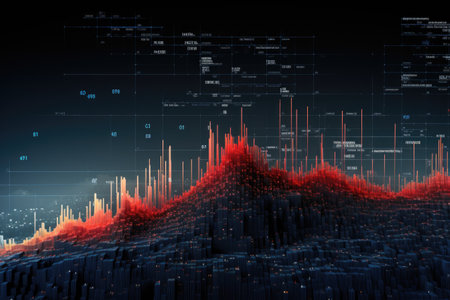
Image of data processing over cityscape. Global technology, computing and digital interface concept digitally generated image.
Коллекция по умолчанию
Коллекция по умолчанию
Создать новую
Business growth analytics marketing and statistics closeup
Коллекция по умолчанию
Коллекция по умолчанию
Создать новую

Financial statistics documents ball pen infographics
Коллекция по умолчанию
Коллекция по умолчанию
Создать новую
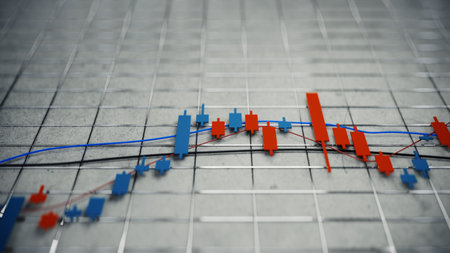
stock market candle stick chart, 3d rendering
Коллекция по умолчанию
Коллекция по умолчанию
Создать новую
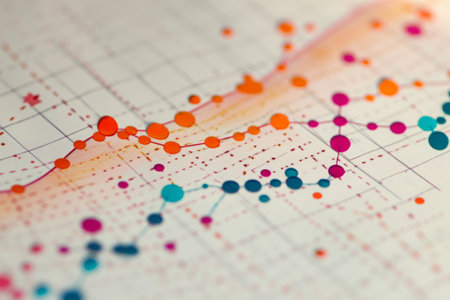
This close-up photograph showcases a paper with numerous dots in varying sizes and positions, A scatter plot showing risk vs return for various investments, AI Generated
Коллекция по умолчанию
Коллекция по умолчанию
Создать новую
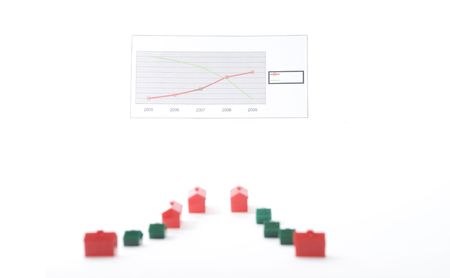
in the news today the failing housing industry
Коллекция по умолчанию
Коллекция по умолчанию
Создать новую

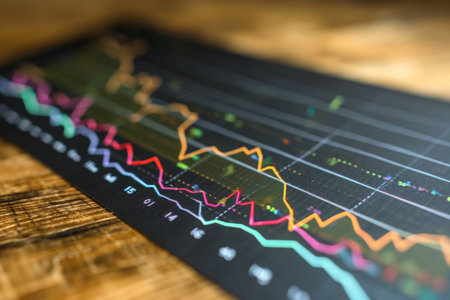
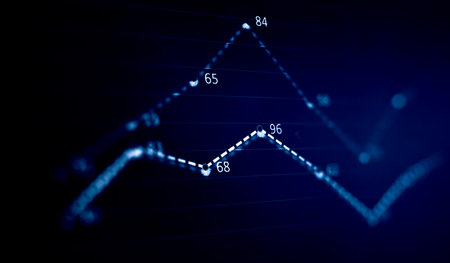
an abstract linear data graph is depicted in this high-quality, uhd image. the graph features precisionist lines and shapes, resembling colorful landscapes. set against a white background, the innovative page design showcases the integration of text and lines. this image is perfect for engineering, construction, and design-related projects, offering a visually appealing representation of data. ai generated
Коллекция по умолчанию
Коллекция по умолчанию
Создать новую
Business chart lie on the office table background. Financial education concept
Коллекция по умолчанию
Коллекция по умолчанию
Создать новую
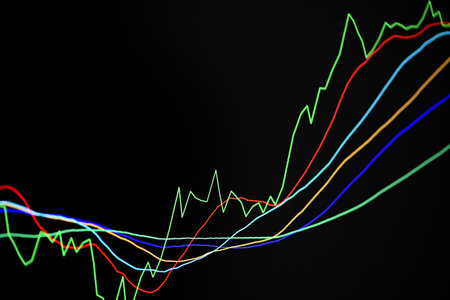
3d illustration of colorful sound wave on dark background. Music concept, A colorful 3D line graph indicating a rise in stock market, AI Generated
Коллекция по умолчанию
Коллекция по умолчанию
Создать новую

Graph of the ballpoint pen and the share price
Коллекция по умолчанию
Коллекция по умолчанию
Создать новую

Digital composite of Man looking through binoculars against grey background with arrows
Коллекция по умолчанию
Коллекция по умолчанию
Создать новую

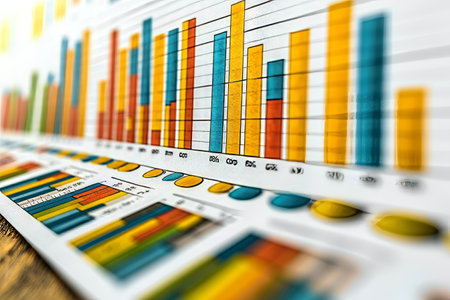
Financial bar chart graph analysis.
Коллекция по умолчанию
Коллекция по умолчанию
Создать новую

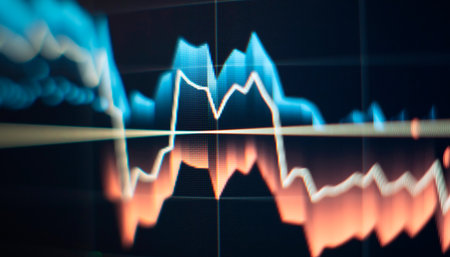
Stock market or forex trading graph and candlestick chart suitable for financial investment concept. Economy trends background for business idea and all art work design. Abstract finance background.
Коллекция по умолчанию
Коллекция по умолчанию
Создать новую
Chart and Pencil
Коллекция по умолчанию
Коллекция по умолчанию
Создать новую

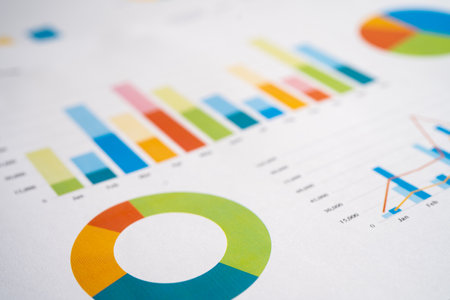
Charts Graphs paper. Financial development, Banking Account, Statistics, Investment Analytic research data economy, Stock exchange Business office company meeting concept.
Коллекция по умолчанию
Коллекция по умолчанию
Создать новую
Chart graph paper. Finance, account, statistic, investment data economy, stock exchange business.
Коллекция по умолчанию
Коллекция по умолчанию
Создать новую
Commercial Finance
Коллекция по умолчанию
Коллекция по умолчанию
Создать новую
Showing graph line on white paper background.
Коллекция по умолчанию
Коллекция по умолчанию
Создать новую
Candle stick graph chart of stock market investment trading.
Коллекция по умолчанию
Коллекция по умолчанию
Создать новую
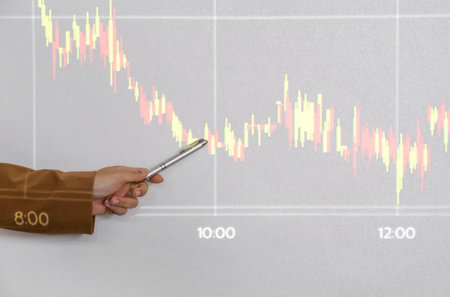
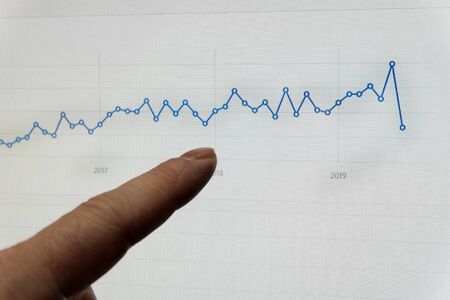
A professional woman, donned in a fitted business suit, as she intently point towards an upward trending stocks chart highlighted on a digital screen.
Коллекция по умолчанию
Коллекция по умолчанию
Создать новую

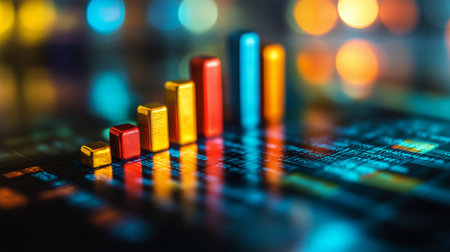
Close up 3d render of business graph with orange and blue bar charts on table and blurred background
Коллекция по умолчанию
Коллекция по умолчанию
Создать новую
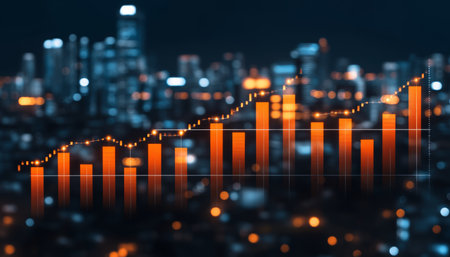
The sleek, illuminated bar graph displays data trends on a glossy table in a contemporary office environment at night, highlighting growth and analysis.
Коллекция по умолчанию
Коллекция по умолчанию
Создать новую
3D Rendering of financial candlestick chart with red and blue bars, light yellow background, concept of stock market data and analysis
Коллекция по умолчанию
Коллекция по умолчанию
Создать новую
3d representation of a blue bar graph with data visualization on a dark background
Коллекция по умолчанию
Коллекция по умолчанию
Создать новую
Business accounting background
Коллекция по умолчанию
Коллекция по умолчанию
Создать новую

Goal business success strategy chart target and planning. Stock market, Business growth, progress or success. Stock market graph financial profit stock market development.
Коллекция по умолчанию
Коллекция по умолчанию
Создать новую

Stocks and shares
Коллекция по умолчанию
Коллекция по умолчанию
Создать новую
reports and histograms on paper on the table in the hands of a girl, analytics and statistics on paper, business analytics
Коллекция по умолчанию
Коллекция по умолчанию
Создать новую
graph chart of stock market investment trading.
Коллекция по умолчанию
Коллекция по умолчанию
Создать новую

top view office desk with growth chart laptop. Resolution and high quality beautiful photo
Коллекция по умолчанию
Коллекция по умолчанию
Создать новую
This photo showcases a close up of a wooden table with a clearly visible graph, providing a detailed representation of data, A line graph showcasing cryptocurrency investment trends, AI Generated
Коллекция по умолчанию
Коллекция по умолчанию
Создать новую

financial graph on the stock market for financial investment concept. Economy trends background for business idea and all art work design. Abstract finance background.
Коллекция по умолчанию
Коллекция по умолчанию
Создать новую
financial graph of investment growth
Коллекция по умолчанию
Коллекция по умолчанию
Создать новую
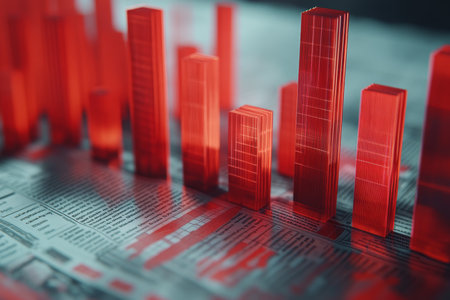
Close up 3d render of a red bar graph featured on a financial newspaper for economic analysis
Коллекция по умолчанию
Коллекция по умолчанию
Создать новую
business analysis documents on office table and graph financial with social network diagram, vintage tone
Коллекция по умолчанию
Коллекция по умолчанию
Создать новую

Declining graph. Printed on paper. On a wooden texture.
Коллекция по умолчанию
Коллекция по умолчанию
Создать новую
Graphs and charts on paper showing financial planning.
Коллекция по умолчанию
Коллекция по умолчанию
Создать новую

Minimalist 3D bar graph on a solid background, conveying business growth concept
Коллекция по умолчанию
Коллекция по умолчанию
Создать новую
Visual representation of trade analytics graphs and charts analyzing global market trends
Коллекция по умолчанию
Коллекция по умолчанию
Создать новую
financial document business data graph.
Коллекция по умолчанию
Коллекция по умолчанию
Создать новую
note book and chart on the wooden table
Коллекция по умолчанию
Коллекция по умолчанию
Создать новую
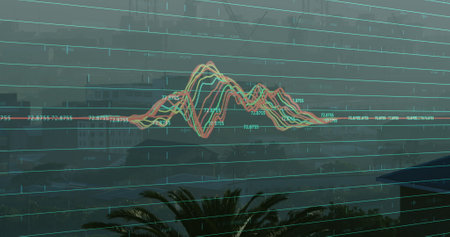
Image of finacial data processing over cityscape. Global business, finances, data processing and digital interface concept digitally generated image.
Коллекция по умолчанию
Коллекция по умолчанию
Создать новую

Bell Shaped Graph Icon in trendy flat style isolated on soft blue background
Коллекция по умолчанию
Коллекция по умолчанию
Создать новую
Analysis of stock exchange trading schedules .
Коллекция по умолчанию
Коллекция по умолчанию
Создать новую
Business graph and trade monitor
Коллекция по умолчанию
Коллекция по умолчанию
Создать новую
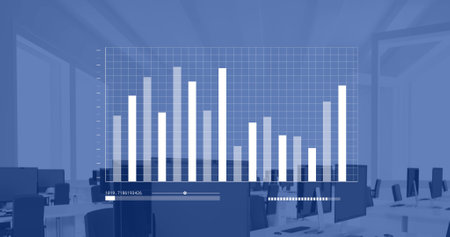
Image of statistical data processing against empty office. Computer interface and business data technology concept
Коллекция по умолчанию
Коллекция по умолчанию
Создать новую
Charts Graphs paper. Financial development, Banking Account, Statistics, Investment Analytic research data economy, Stock exchange Business office company meeting concept.
Коллекция по умолчанию
Коллекция по умолчанию
Создать новую

Business graph chart on economic background. 3d illustration
Коллекция по умолчанию
Коллекция по умолчанию
Создать новую
Calculator and graphs
Коллекция по умолчанию
Коллекция по умолчанию
Создать новую
Investment Growth, Stock Market Uptrend in City Skyline, Business and Financial Chart Background
Коллекция по умолчанию
Коллекция по умолчанию
Создать новую

work place with cup of coffee,Empty workspace on wooden table.
Коллекция по умолчанию
Коллекция по умолчанию
Создать новую
3d illustration of graph on a digital background. 3d rendering
Коллекция по умолчанию
Коллекция по умолчанию
Создать новую

Graphic detail stock exchange market indicators
Коллекция по умолчанию
Коллекция по умолчанию
Создать новую
Photo of rising graph painted with chalk on dark chalkboard
Коллекция по умолчанию
Коллекция по умолчанию
Создать новую
Image of digital interface showing statistics with a world map. Digital interface and global business, digitally generated image
Коллекция по умолчанию
Коллекция по умолчанию
Создать новую

close-up of upward-trending bar chart, with numbers and labels visible, created with generative ai
Коллекция по умолчанию
Коллекция по умолчанию
Создать новую
Graphs and Charts. Flowcharts. Statistic. Macro. Blue color.
Коллекция по умолчанию
Коллекция по умолчанию
Создать новую

Charts Graphs paper. Financial development, Banking Account, Statistics, Investment Analytic research data economy, Stock exchange Business office company meeting concept.
Коллекция по умолчанию
Коллекция по умолчанию
Создать новую
Image of digital data processing over statistics. Global connections, computing and data processing concept digitally generated image.
Коллекция по умолчанию
Коллекция по умолчанию
Создать новую

businessman working data document graph chart report marketing research development planning management strategy analysis financial accounting.
Коллекция по умолчанию
Коллекция по умолчанию
Создать новую
stock market candle stick chart, 3d rendering
Коллекция по умолчанию
Коллекция по умолчанию
Создать новую

Multi exposure of forex graph hologram over desktop with phone. Top view. Mobile trade platform concept.
Коллекция по умолчанию
Коллекция по умолчанию
Создать новую
Composite of landscape and data processing with red dot. Global networks, connections and data processing concept digitally generated image.
Коллекция по умолчанию
Коллекция по умолчанию
Создать новую

Chart, graph and info graphics 3d design for data analysis, seo tools or statistics background
Коллекция по умолчанию
Коллекция по умолчанию
Создать новую
Image of data processing over landscape. global connections, digital interface and technology concept digitally generated image.
Коллекция по умолчанию
Коллекция по умолчанию
Создать новую
Detailed bar charts and graphs illustrate data trends and statistics across various categories, highlighting important information for analysis in a research or business context.
Коллекция по умолчанию
Коллекция по умолчанию
Создать новую
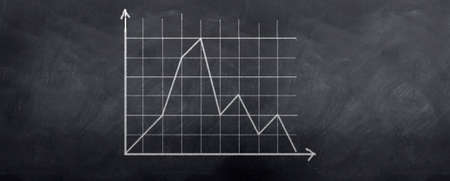
A graph showing a stock in decline over time. Written in chalk on a blackboard.
Коллекция по умолчанию
Коллекция по умолчанию
Создать новую

Chart graph paper. Finance, account, statistic, investment data economy, stock exchange business.
Коллекция по умолчанию
Коллекция по умолчанию
Создать новую
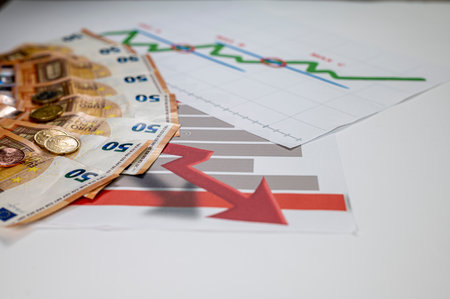
50 euro banknotes coins and statistics on white background
Коллекция по умолчанию
Коллекция по умолчанию
Создать новую
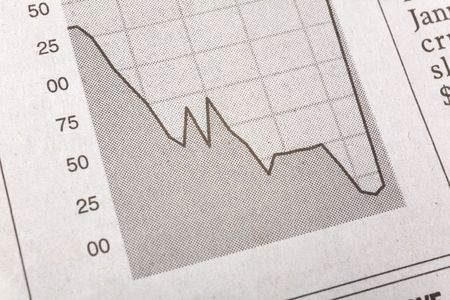
Newspaper Business Chart, financial concept
Коллекция по умолчанию
Коллекция по умолчанию
Создать новую

Abstract background. Futuristic technology style. Elegant background for business tech presentations.
Коллекция по умолчанию
Коллекция по умолчанию
Создать новую

A bar graph with lights on it and a blurry background, AI
Коллекция по умолчанию
Коллекция по умолчанию
Создать новую
Image of interface with statistical data processing against grey background. Computer interface and business data technology concept
Коллекция по умолчанию
Коллекция по умолчанию
Создать новую
Business and Asset Management Creative graphics showing economy and financial growth by investing in the basic concept of finance and money technology of wealth.
Коллекция по умолчанию
Коллекция по умолчанию
Создать новую

Business concept. Red pencil on the background of the diagram
Коллекция по умолчанию
Коллекция по умолчанию
Создать новую

Close up hand of business man with financial report accounting analysis.
Коллекция по умолчанию
Коллекция по умолчанию
Создать новую

Simulation of a financial study
Коллекция по умолчанию
Коллекция по умолчанию
Создать новую
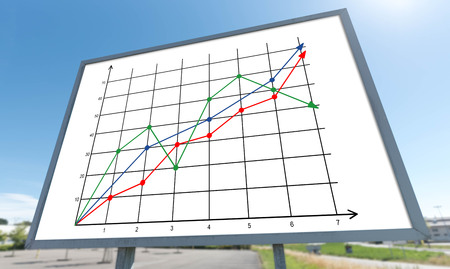
Business analysis concept drawn on a billboard
Коллекция по умолчанию
Коллекция по умолчанию
Создать новую
stock market, economic graph with diagrams, business and financial concepts and reports, abstract technology communication concept vector background
Коллекция по умолчанию
Коллекция по умолчанию
Создать новую
Analysis, chart and screen hologram of stock market, financial management and investment profit
Коллекция по умолчанию
Коллекция по умолчанию
Создать новую

Double exposure of forex graph hologram over desktop with phone. Top view. Mobile trade platform concept.
Коллекция по умолчанию
Коллекция по умолчанию
Создать новую
Creative glowing forex chart on dark background with lines and bars. Investment and market concept. 3D Rendering
Коллекция по умолчанию
Коллекция по умолчанию
Создать новую
A detailed view of a paper displaying a bar chart, illustrating data trends and comparisons, A graph that represents the risk and reward ratio of a certain investment, AI Generated
Коллекция по умолчанию
Коллекция по умолчанию
Создать новую
Business graph background: Analysis business accounting on info sheets.
Коллекция по умолчанию
Коллекция по умолчанию
Создать новую

abstract glowing forex chart background. 3d rendering toned image
Коллекция по умолчанию
Коллекция по умолчанию
Создать новую
Abstract glowing candlestick forex chart with index and grid on dark background. Invest, trade, finance ans stock market concept. 3D Rendering
Коллекция по умолчанию
Коллекция по умолчанию
Создать новую
Top view of office workplace table with charts report on wooden clipboard, coffee, supplies and laptop.
Коллекция по умолчанию
Коллекция по умолчанию
Создать новую
Charts Graphs spreadsheet paper. Financial development, Banking Account, Statistics, Investment Analytic research data economy, Stock exchange Business office company meeting concept.
Коллекция по умолчанию
Коллекция по умолчанию
Создать новую
Abstract creative financial graph interface and world map on stacks of coins background, forex and investment concept. Multiexposure
Коллекция по умолчанию
Коллекция по умолчанию
Создать новую
A bar graph over a green surface
Коллекция по умолчанию
Коллекция по умолчанию
Создать новую
Financial data graph at stock exchange
Коллекция по умолчанию
Коллекция по умолчанию
Создать новую
Stock trading graphic design for financial investment trade, Forex graph business or Stock graph line chart market exchange ,Technical price line with indicator on chart computer screen background
Коллекция по умолчанию
Коллекция по умолчанию
Создать новую
Pointing to stock chart graph for finances showing growth profits and losses
Коллекция по умолчанию
Коллекция по умолчанию
Создать новую
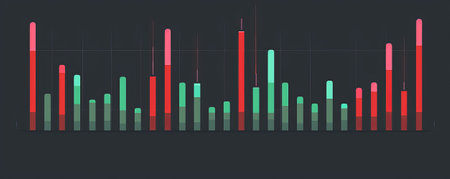
A bold bar chart with green bars rising sharply and red bars dropping steeply, representing stock market changes, set against a dark gray background.
Коллекция по умолчанию
Коллекция по умолчанию
Создать новую
Pie chart with world map
Коллекция по умолчанию
Коллекция по умолчанию
Создать новую
Legion-Media
Создайте свои проекты на основе качественных стоковых фотографий и видео.


Copyright © Legion-Media.